How excel users can start using PowerBI


How Excel Users Can Start Using Power BI: A Step-by-Step Beginner’s Guide
Excel users already know how to work with data. If you use formulas, PivotTables, charts, or Power Query, you already have the skills needed to start using Power BI. Power BI doesn’t replace Excel—it expands what Excel users can do with automation, interactive dashboards, and scalable reporting.
This guide is optimized for Excel users who want to learn how to start using Power BI, what skills transfer, and how to move from spreadsheets to dashboards with confidence.
Why Excel Users Should Start Using Power BI
Excel is excellent for analysis and flexibility, but Power BI is designed for ongoing reporting and data sharing. Excel users typically move to Power BI when they need to:
- Automate recurring reports
- Work with larger datasets
- Create interactive dashboards
- Share reports without emailing files
- Ensure everyone sees the same numbers
Power BI builds on Excel concepts while removing many of Excel’s limitations.
What Excel Skills Transfer Directly to Power BI?
One reason Power BI is easy for Excel users to learn is that many core concepts are the same.
Excel Skills You Already Use
- Tables and structured data
- PivotTables and summaries
- Filters and slicers
- Charts and visual analysis
How They Translate in Power BI
- PivotTables → Interactive visuals
- Excel tables → Data model tables
- Slicers → Page and report filters
- Charts → Dashboards
If you can build a PivotTable, you can build a Power BI report.
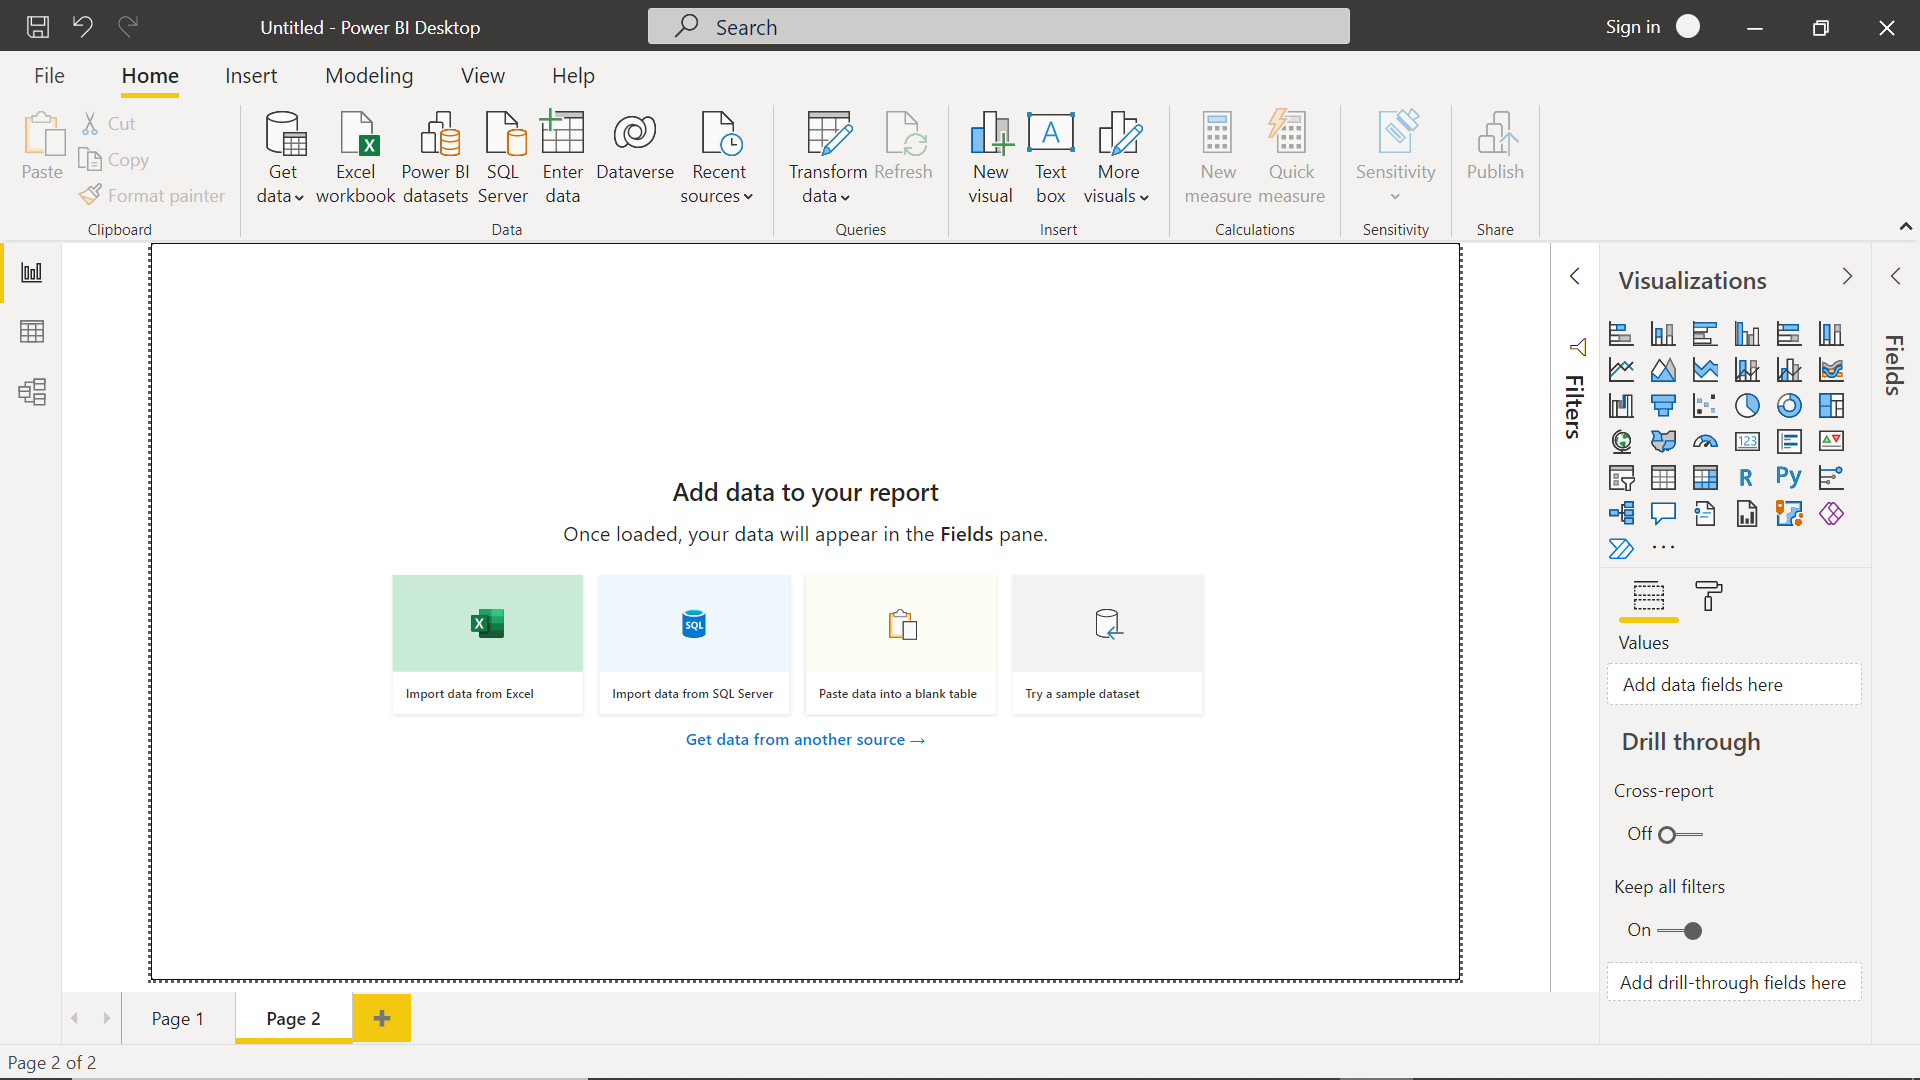
Step 1: Download Power BI Desktop and Connect to Excel
The best way for Excel users to start using Power BI is with Power BI Desktop, the free report-building tool.
Getting Started
- Install Power BI Desktop
- Open it and select Get Data → Excel
- Import a spreadsheet you already use
Choose a file that already feeds reports or summaries—this makes the transition easier.
Step 2: Clean and Transform Data with Power Query
Excel users familiar with Power Query will feel right at home.
Common Data Cleanup Tasks
- Removing blank rows and columns
- Splitting text into multiple columns
- Changing data types
- Combining multiple files
Power BI uses the same Power Query engine as Excel, but now your cleanup steps run automatically every time the data refreshes.
SEO Tip: One of the biggest advantages of Power BI for Excel users is eliminating manual data cleanup.
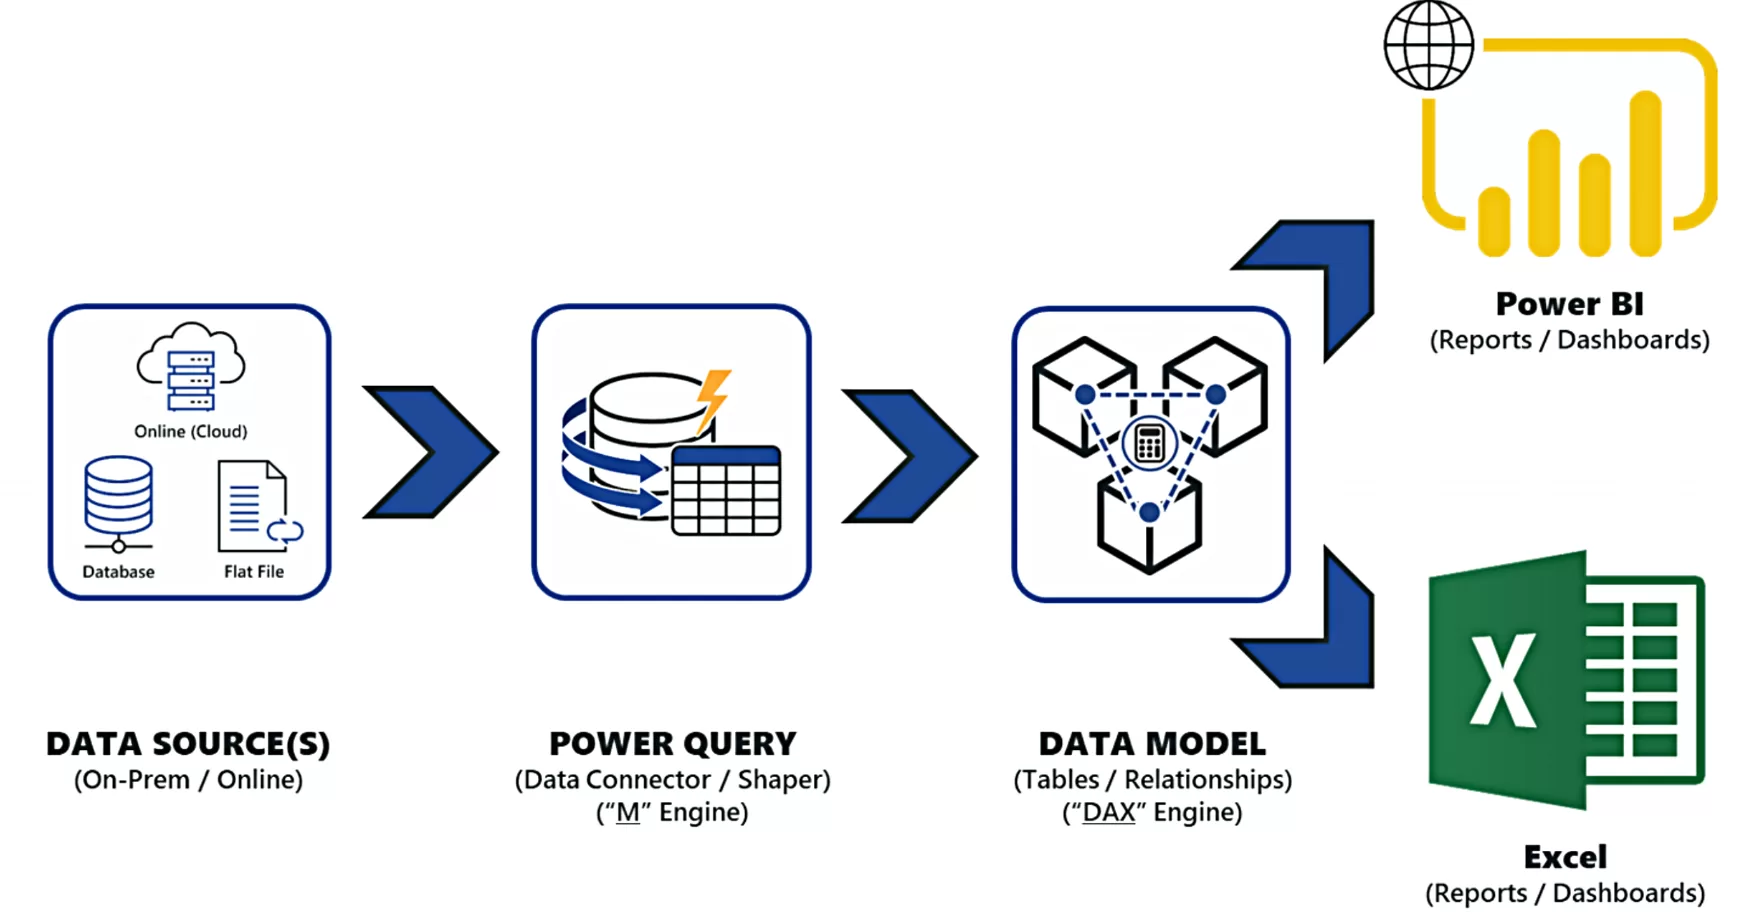
Step 3: Move Beyond Flat Files with a Data Model
Excel users often rely on one large worksheet. Power BI works best with a data model.
What This Means
- Separate tables (Sales, Customers, Products, Dates)
- Relationships instead of VLOOKUP or XLOOKUP
- Faster, more accurate reporting
This structure makes reports easier to maintain and scale as data grows.
Step 4: Learn Basic DAX for Power BI
DAX (Data Analysis Expressions) sounds intimidating, but Excel users already understand most of it.
Familiar Excel Concepts
- SUM and AVERAGE
- IF logic
- Time-based calculations
Beginner DAX Examples
- Total Sales
- Year-to-Date totals
- Month-over-Month growth
You don’t need advanced DAX to get started—simple measures go a long way.
Step 5: Build Interactive Reports Instead of Static Excel Charts
This is where Excel users really see the benefit of Power BI.
Key Differences from Excel
- Clicking one visual filters the entire report
- Drill-down replaces multiple worksheets
- One report can answer many questions
Many Excel users find that one Power BI dashboard replaces several Excel reports.
Step 6: Publish and Share Power BI Reports
Instead of emailing spreadsheets, Power BI lets you publish reports securely.
Benefits for Excel Users
- Automatic data refresh
- One version of the truth
- Browser and mobile access
- Controlled access for viewers
Once published, stakeholders always see up-to-date data without asking for a new file.
A Simple Transition Plan for Excel Users
You don’t need to abandon Excel to start using Power BI.
Recommended Approach
- Keep Excel for ad-hoc analysis
- Use Excel as a data source
- Move recurring reports to Power BI
- Build dashboards for leadership
This hybrid approach works well for most businesses.
Common Mistakes Excel Users Should Avoid
- Importing messy spreadsheets without cleaning them
- Recreating complex Excel formulas instead of using measures
- Ignoring relationships and using one giant table
- Treating Power BI like a static reporting tool
Avoiding these mistakes early will save time and frustration.
Final Thoughts: Power BI Is the Next Step for Excel Users
For Excel users, learning Power BI is not a major leap—it’s a natural progression. Your existing skills transfer directly, and the payoff is faster reporting, automation, and better insights.
If you’re wondering how Excel users can start using Power BI, the answer is simple: start with one Excel file, build one report, and grow from there.